It’s pretty common for an eCommerce marketing team to rely on Facebook Ads to drive traffic that results in product sales in their online store. It’s also pretty common for them to wonder why they aren’t getting the conversion rates they want, even though their ads are compelling and their product is something people obviously want (otherwise, they wouldn’t be selling it).
If you’ve found yourself in either of these predicaments, it’s time to get smarter about your Facebook Ads strategy.
In order to be successful with Facebook marketing for eCommerce, you need to understand and track key metrics in your sales funnel. In this article, we’ll outline 21 of the most important eCommerce conversion funnel metrics, and explain how to track them using Facebook Ads Manager.
Discovery Metrics (also called awareness)

At this stage of the funnel, you should focus your marketing efforts on generating brand awareness and building demand for your product.
Your top four discovery metrics or KPIs(Key performance indicators) should include:
1. Ad Impressions Metric
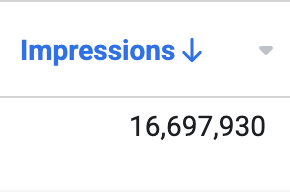
Impressions are the number of times your ad is shown. The impression is counted when people load an ad on a third-party website, such as in search results(on Google, Bing), or their social media(Facebook, Instagram, Tiktok, etc.).
The impression does not always mean someone will click on the ad and visit your website. Heck, it doesn’t even necessarily mean the person actually saw your advertisement(due to banner blindness or lack of focus). It simply means the ad was loaded and visible on the person’s browser.
The impression is one of the most reliable metrics to track because it depends mostly on how much money you spend.
2. Ad Reach Metric
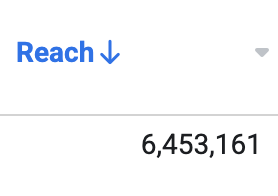
Reach refers to the number of individual users that viewed content on your advertising platform of choice(Facebook for ex.).
Reach metrics give marketers an idea of how broad their message is reaching, and whether or not people are actually seeing their content.
While Ad impressions can be counted several times per individual user, reach counts just “1 impression” per user. 1000 reach impressions = 1000 individuals who saw your ad.
The better defined your brand messaging is, the more effective your campaigns will be to improve reach.
Reach can be affected by your bid, budget, audience targeting, and demographics, but also your campaign optimization.
In general, you will want to reach as many potential customers as possible and convert them into loyal customers.
3. Ad Frequency Metric
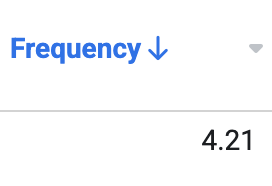
Ad frequency is the average number of times users see your ad within a given timeframe. This is a useful metric to measure how many times an individual user needs to see your ad before becoming a paying customer.
Optimal ad frequency could be anywhere from 1.5x – 15x per user (yes, you read that right). This is highly dependent on your targeting, ad creative, copywriting, offer, demographics, and so on.
If your ad frequency is high, your click-through rates will most likely drop, and your CPM could start getting more expensive. If you’re experiencing any of those two, then it’s probably time to refresh your creatives and bring something new to the table.
You shouldn’t solely base your decisions to turn on/off ads based on the frequency metric alone – it is just one of many to things consider after add-to-carts, purchases, ROAS, and other more important indicators.
4. Facebook Engagement Metric
The engagement metric shows how engaging your content/advertisement is on Facebook.
Essentially, how much of your “reach” is engaging with your content.
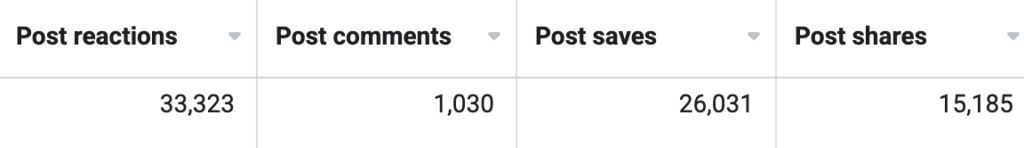
Here are some engagement metrics you need to know, lined up from most important to least:
- Comments
- Shares
- Post Saves
- Likes & Reactions
Likes and reactions are the least important because they require the least effort from the user and don’t necessarily display a high level of interest. Comments & shares show some level of emotional engagement with what you are displaying.
Consideration Metrics (also called User Acquisition)

At this stage of the funnel, users are already aware of your brand(they’ve seen your ads and have possibly engaged with them). Now they have landed directly on your landing pages.
In the user acquisition stage, you want to get potential and existing customers to spend some time and engage with the content on your website. Google Analytics makes it easy to track these traffic metrics within a single dashboard.
5. Sessions
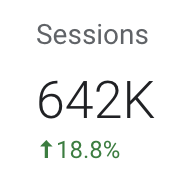
In eCommerce, the session metric is mainly used to understand how many times a user visits your online store before purchasing something.
Google Analytics counts a session as long as the user interacts with your website within 30 minutes.
Here’s how Google defines it: “By default, if a user is inactive for 30 minutes or more, any future activity is attributed to a new session. Users that leave your site and return within 30 minutes are counted as part of the original session.”
6. Bounce Rate Per Session
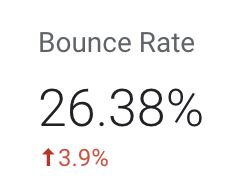
A bounce is a single-page session on your website. Bounce rate is essentially how many people visit your landing page, and don’t browse any further.
Let’s say 100 people visit your site(a session), and 10 of them leave without clicking on any other pages, your bounce rate would be 10%. The average bounce rate for an eCommerce store is around 20-40%, according to Neil Patel.
If you have a bounce rate that is too high, try speaking to your designer or revamping your landing page copy/design/offer/etc.
Bounce rates are very important when it comes to Facebook traffic because Facebook will start charging you more when bounce rates are too high. If they bounce off the page immediately, then you need to give your user a better on-page experience.
Whatever you do, remember – the lower the bounce rate, the better (usually)!
7. Pages Per Session
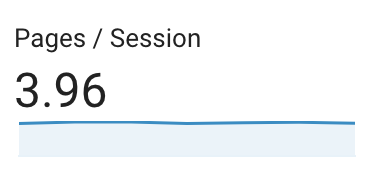
This metric refers to the average amount of pages viewed per session on your eCommerce website.
The more detail you have here, the higher quality traffic you are typically seeing from Facebook Ads. A good indicator here is at least 2 pages per session.
If you notice that the average pages per session metric is low, it could mean that your offer/page design/CTA/copy is not compelling enough to drive people through the rest of your conversion funnel. Test different landing page designs and copies to achieve a better result.
8. Average Session Duration
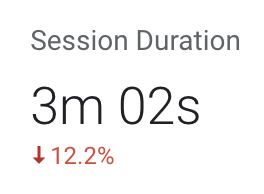
The average session duration will tell you how much time, on average, someone spends interacting with your eCommerce website.
The average eCommerce website session duration is about 2-3 minutes according to databox.com.
This eCommerce metric is great to use as a benchmark for your eCommerce website’s performance.
If this number is too low(under 2 minutes on average), examine your offer, page design, and copywriting and look for opportunities where you could make it more engaging.
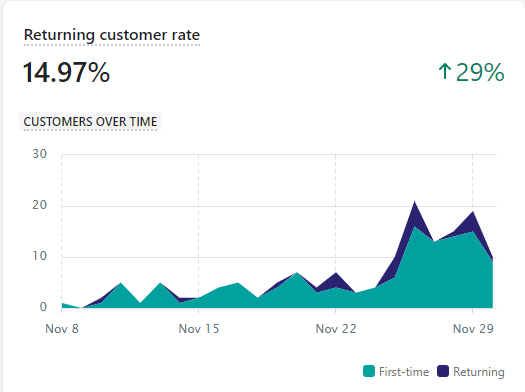
9. New vs Returning Visitors
Typically, eCommerce businesses will see higher conversion rates from repeat visitors than new ones. This makes sense because people who come back, again and again, are aware of the quality of service and trust the business more.
If you’re not getting too many returning visitors and buyers, look for opportunities to put more intriguing offers in front of them. The cost per purchase is typically going to be much cheaper.
10. Click-through Rate

Click-through rate or CTR is the number of clicks on your ad divided by the total number of people that saw it, resulting in percentage value.
An example would be: If you had 100 clicks and 1000 impressions, it would be a 10% CTR.
This eCommerce metric is important because it measures how successful your ad campaigns are in enticing people to visit your website. The higher the click-through rate, the more effective your ads are at getting website traffic to your eCommerce site.
You can get CTR metrics from Facebook Ads Manager or Google Analytics.
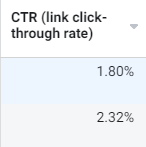
If you have a low CTR, it might mean that your ads are not targeting the right people or that the ads themselves need to be more compelling.
11. Cost Per Click
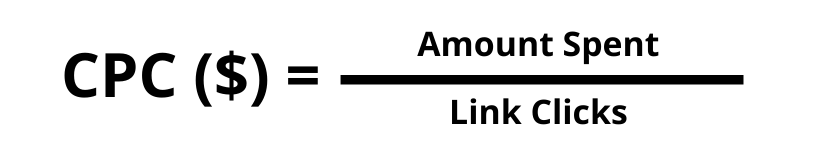
CPC is the average amount of money you spend to get someone to click on your ad.
This eCommerce metric is important because it tells you how much you’re spending on getting people to visit your website.
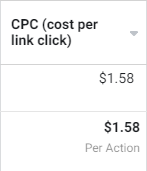
The average cost of a click on Facebook is $1.72, while the average cost of a click on Google is $2.32, according to eCommerceFuel. This is a gross average though and varies widely based on your niche.
If your CPC is too high, it might mean that you’re targeting the wrong people or that your eCommerce Facebook Ads need to be more compelling.
On the other hand, as long as your ad is profitable, CTR will be less relevant.
Facebook Ad Funnel KPIs
Conversion metric indicates how effectively your eCommerce website is converting traffic into leads and revenue.
There are some eCommerce Facebook Ad Conversion KPIs that you should be aware of:
12. Customer Acquisition Cost(CAC)

CAC(customer acquisition cost) helps you calculate the value of your marketing efforts. To determine CAC, add together all marketing costs and services, including software, and overhead, and divide by the number of customers acquired.
For example, You spend $10,000 on marketing(including all the tools, rent, salaries, etc) in a given year and acquire 500 customers. Your CAC would be $20 per customer. CAC helps you determine how much should you be willing to spend for a customer, and if your advertising is effective.
13. Return on Ad Spend (ROAS)

ROAS is a metric that tells you how much revenue your ads are generating relative to the money spent.
ROAS is a valuable metric because it tells you how effective your Facebook Ads are at generating revenue.
It does not mean much alone, since it does not account for any costs(like product cost, shipping, labeling, etc).
In order to calculate if you are profitable, you will need to calculate your (breakeven)BEROAS first and compare the ROAS of the campaign/ad set/ad to your BEROAS.
Read below for an explanation of breakeven ROAS.
14. Breakeven Return On Ad Spend(BEROAS)

By including costs that ROAS misses like Cost of Goods(COGs), Shipping & Handling, Packaging Costs, Labour Costs, Taxes, Transfer Fees, etc BEROAS gives us a much clearer picture of how much we need to be making from our adverts which lets us plan and price our products accordingly.
To calculate BEROAS for a specific product, divide 1 by your average profit margin percentage. The formula: Break-even ROAS = 1 / Average Profit Margin %.
For example, let’s say your profit margin is 50%. That would mean that your BEROAS is 2 (1 / 0.5). Now let’s say that your product costs $50 in total (including shipping, handling, etc.) and you generate $100 in revenue from Facebook Ads. Your ROAS would be 2 ($100/$50).
To determine the profitability of your advertisement, simply compare your BEROAS to ROAS. If your ROAS is higher than the breakeven ROAS, your advertising campaign is profitable.
15. Average Order Value (AOV)

AOV is the average amount of money a customer spends on a purchase.
This metric is important because it tells you how much revenue your eCommerce website is generating on average from each purchase.
You can calculate AOV by dividing total revenue by the total number of orders. For example, if your eCommerce website generated $10,000 in revenue from 1,000 orders, your AOV would be $10.
AOV is important to track because it can help you determine whether or not you’re losing money on some of your sales. If the AOV is lower than the product cost, you might need to reconsider your prices.
To increase AOV, you might want to bundle several products together or use upselling and cross-selling tactics.
Formula to calculate AOV: Total sales ÷ Number of transactions
16. Cart Abandonment Rate
Abandonment rate is the percentage of eCommerce website visitors who add items to their cart but do not make a purchase.
In eCommerce, cart abandonment happens all the time when visitors add products to online shopping carts and then leave the site without buying anything. Cart abandonment can happen for a wide number of reasons:
- the purchase process is too complicated
- the visitor is comparison shopping
- the cost of shipping is too high
- the product isn’t exactly what was expected
The cart abandonment rate is an important metric because it can help you determine how effective your eCommerce website is at converting traffic into customers.
You can calculate the cart abandonment rate by dividing the number of abandoned carts by the number of total carts.
For example, if your eCommerce website has 100 abandoned carts and 1,000 total carts, your cart abandonment rate would be 10%.
You can take steps to reduce your cart abandonment rate by making the purchase process easier, offering free shipping, and ensuring that your products are as described.
17. Conversion Rate
Conversion rate is the percentage of website visitors who make a purchase.
This metric is important because it tells you how effective your eCommerce website is at converting traffic into customers.
You can calculate the conversion rate by dividing the number of transactions by the number of visitors.
For example, if your eCommerce website had 1,000 transactions from 100,000 visitors, your conversion rate would be 1%.
You can improve your eCommerce conversion rate by making it easier for visitors to make a purchase, by providing more product information, and by ensuring that the checkout process is easy.
Formula to calculate conversion rate: Transactions ÷ Visitors
18. Sales Generated by Channel
Channel sales show you how much revenue was generated through a specific marketing or selling channel.
Review this metric to understand what channels and platforms are worth the investment, and what channels you can spend less on(or completely drop).
For example, if your website generates $20,000 in revenue through Facebook Ads and only $5,000 through Google Ads, you might want to focus more of your time and energy on Facebook Ads.
You can calculate channel sales by measuring sales attributed to a specific channel.
Retention KPIs (Repeat Buyer Metrics)

To reduce this abandonment rate and increase sales volume, marketers need to focus on customer retention metrics (also known as repeat buyer metrics). These KPIs measure how many customers return after making a first purchase and how long they stick around.
They can help you determine which products are popular with your customers and what content marketing strategies work best for them – thereby giving you an edge over competitors who focus only on acquisition metrics like conversion rates or customer lifetime value.
Here are three eCommerce retention KPIs you should have on your radar:
27. Average Customer Lifetime Value (CLV)

In eCommerce, the average customer lifetime value (CLV) is the amount of money a customer spends on your website throughout their lifetime.
This metric is important because it helps you understand how much revenue you can expect to generate from each customer.
You can calculate CLV by dividing total revenue by the number of customers.
For example, if your eCommerce website generated $100,000 in revenue from 1,000 customers, your CLV would be $100.
You can use CLV to determine how much you should spend to acquire a customer (CAC).
If you know that the average customer lifetime value is $1,000, you can sometimes be much more courageous in your marketing, and even advertise at an initial loss (because you know that the customers will return based on the statistics).
You can also use CLV to determine how much money you should invest in retention activities, such as loyalty programs and customer service.
28. Repeat Purchase Rate
The repeat purchase rate is the percentage of customers who make a second purchase within a given time frame.
This metric is important because it tells you how successful your eCommerce website is at retaining customers.
You can calculate the repeat purchase rate by dividing the number of customers who made a second purchase by the total number of customers.
For example, if your eCommerce store had 100 customers who made a second purchase out of your total 1000 customers, your repeat purchase rate would be 10%.
You can increase your repeat purchase rate by providing incentives for customers to make a second purchase, by offering discounts for returning customers, and by providing customer service that exceeds expectations.
30. Return on Investment (ROI)

ROI is the king of business. It’s what CEOs and shareholders want to hear about, and it clearly shows what marketing efforts are working (or not working).
The basic formula for ROI is simple: Net profit ÷ total investment (expressed as a percentage). However, keep in mind that the complexity of your ROI formula can vary depending on how your business operates.
Ready to take your eCommerce business to the next level?